
Originally written in Vietnamese for the CADS Blog at FPT Telecom. Translated and republished here.
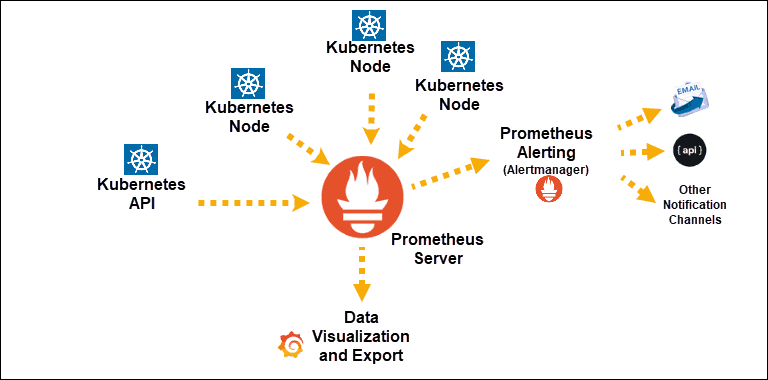
After a short but very rewarding time eating, sleeping and working with Prometheus [prəˈmiːθɪəs], I want to share the story of Prometheus and his trident. It’s a joke of mine: while learning it, I found three sides of Prometheus worth focusing on, each with its own fun to discover — just like a real trident.
Get ready to enter the world of the gods, because we’ll meet more than one of them along the way.
Time Series Database
A Time Series Database (TSDB) is a database built and optimised for storing data points indexed by time — and Prometheus is one. The data it stores are usually metrics: RAM and CPU used by each service, the number of requests to a server, disk usage… anything we want to measure.
Every metric is tied to a timestamp, forming a series of data over time. That lets us look back at how the system behaved an hour or a month ago when investigating an incident. It can also help us spot unusual behaviour early, true to the Prometheus slogan: From metrics to insight!
By default, Prometheus creates and manages a local TSDB on disk, and it can also integrate with external systems for remote storage. See more in the storage docs.
Monitoring and Alerting
A monitoring system gives us an easy view of the health of the applications it watches and the problems they run into. If alerting is set up, it warns us automatically based on alerting rules we configured in advance. Instead of waiting for users to tell us the server is broken, we find and fix the problem before they notice. For large, complex systems, monitoring also shows which components fail most often, so we know where to focus to improve service quality.
A real example: our system receives a steady 500 metrics per minute from a service. Suddenly the monitoring system sees that number spike (or drop). Prometheus sends an alert through a channel of our choice — email, Slack or a webhook — so we can check it right away.
🔥 Sometimes metrics jump up and down constantly and unpredictably, so we need something that stops duplicate notifications. Or a service goes down: once one alert about it has been delivered, monitoring should hold back the rest. Otherwise our inbox or Slack would be flooded with thousands of messages.
Prometheus’s Alertmanager handles exactly that. It can also group alerts before sending them, or silence them for a configured period. It can do this because grouping is based on labels, and each group’s wait time can be tuned in the routing tree of the configuration file.
Query Language and Grafana
Data in Prometheus is queried with PromQL, a built-in query language that lets you select, parse and format metrics using a rich set of operators and functions. Because Prometheus stores time series, it supports time-based range and duration selectors, which makes queries much more efficient.
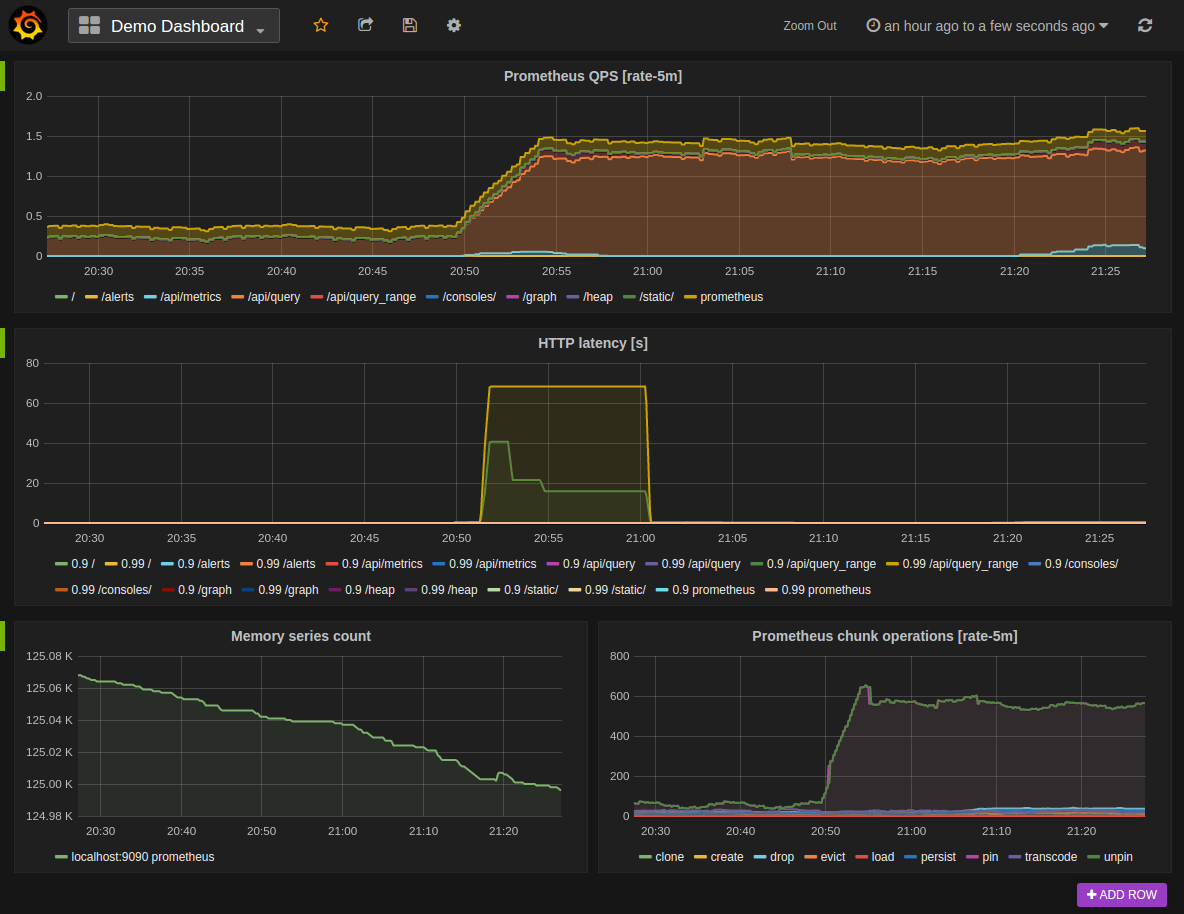
For charts and dashboards, Prometheus integrates with Grafana. Showing data as clear visual charts makes monitoring easier and gives a much better view of the system and the metrics we watch.
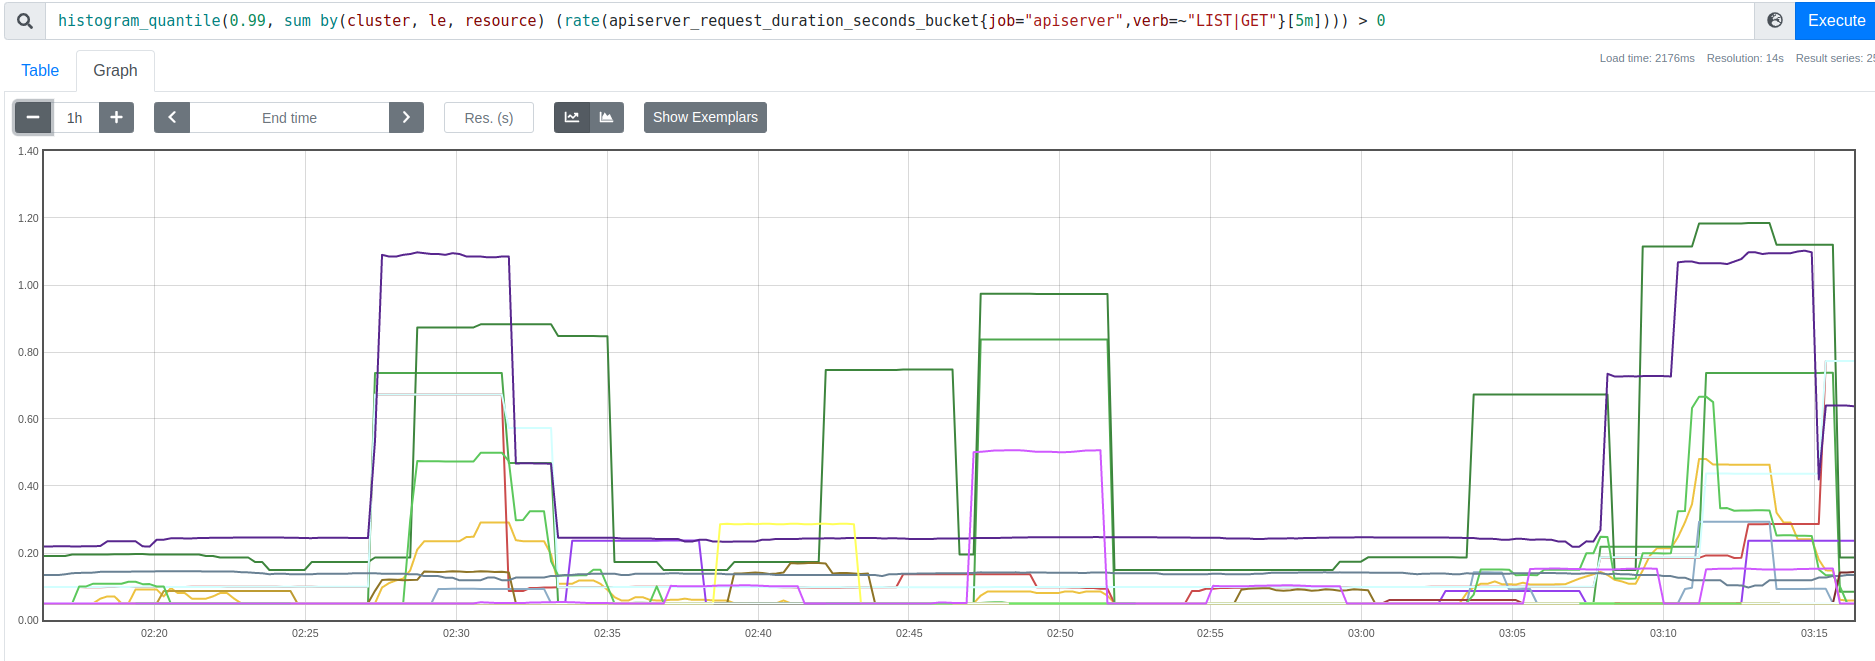
The query above computes the 99th percentile of request duration over the last 5 minutes. The quantile is calculated for each label combination in apiserver_request_duration_seconds_bucket. To aggregate, wrap rate() in sum(), and because histogram_quantile() needs the le label, it must be kept in the by clause:
histogram_quantile(0.99, sum by (le) (rate(apiserver_request_duration_seconds_bucket[5m])))
Wrapping up
Prometheus is a great tool that any monitoring setup needs. It gives us a local time series database (or remote storage through integrations), a rules engine that keeps watching and alerts us whenever a rule is broken, and finally a time series query language plus open-source visualisation to make monitoring the services we care about easier.
Reference: prometheus.io
The Prometheus series
- Part 1. Prometheus and the Story of the Trident 🔱 (you are here)
- Part 2. Prometheus Architecture
- Part 3. The Achilles’ Heel of Prometheus (coming soon…)