
Originally written in Vietnamese for the CADS Blog at FPT Telecom. Translated and republished here.
In Part 1 we looked at the sides that make up the god Prometheus — in Greek mythology, the name means “the one who sees the future” [Προμηθεύς].
Now we’ll go through the features Prometheus offers and dig deeper into its architecture and how it runs. Along the way we’ll compare it with similar systems to show the strengths and weaknesses of each component, and finally answer the question: “When should we use Prometheus?”
Prometheus
Prometheus is an open-source monitoring and alerting toolkit, first built at SoundCloud in 2012. Since its release, many companies and organisations have adopted it, and it has a very active community of developers and users. Today it is an independent open-source project, maintained separately from any single company. On 9 May 2016, Prometheus joined the Cloud Native Computing Foundation as its second hosted project after Kubernetes, to highlight its importance and make its governance clear.
🍻 Prometheus collects and stores metrics as time series data: each value is stored with the timestamp at which it was recorded, together with optional key-value pairs called labels.
Features
Let’s go through what makes Prometheus special, so we can understand it well and get the most out of it.
A multi-dimensional data model for time series. Data can be sliced however we like along the label dimensions we configure. Prometheus stores everything as time series, and it can also produce new series as the result of queries. Each series is uniquely identified by its metric name plus an optional set of labels.
- The metric name describes the general feature being measured, e.g.
kube_pod_container_resource_limits. - Labels identify a specific dimension of that metric, e.g.
kube_pod_container_resource_limits{job="kube-controller-manager"}.
PromQL, a flexible query language built for this data model, used for alerts and graphs. It lets users select and aggregate time series in real time. The result of an expression can be shown as a graph, viewed as a table in Prometheus, or consumed by external systems through the HTTP API.
Collection over HTTP using a pull model. Pulling needs less configuration and makes monitoring more flexible: if an endpoint moves, we don’t have to reconfigure every source. Prometheus scrapes metrics from configured targets at a regular interval called scrape_interval. For a comparison of push and pull, see this post on blog.sflow.com.
Pushing is supported through an intermediary, the Pushgateway. Unlike InfluxDB, Prometheus doesn’t accept metrics pushed to it directly. But some setups are hard to monitor with pull: endpoints that only send metrics occasionally, or jobs that live shorter than scrape_interval. For those, Prometheus offers the Pushgateway.
Targets found through service discovery or static configuration. Prometheus has many built-in ways to find what to scrape, including Kubernetes, Consul and more. If your service discovery system isn’t supported, you can list scrape targets in a JSON file, together with metadata about them. See the simple guide using Node Exporter.
Graphs and dashboards. Prometheus has simple line charts for the results of PromQL queries. That’s often not enough to explore the data, so open-source tools like Grafana are a powerful companion that we can configure to get the most out of it.
Architecture

The main components of a Prometheus system:
Prometheus server — scrapes and stores time series data. The server is the brain of the system: it collects time series, then analyses and aggregates them. Collecting data is called scraping. The server pulls metrics from targets automatically, which cuts down the work needed whenever there’s a new metric to collect.
Pushgateway. It supports short-lived jobs — jobs that don’t live long enough for Prometheus to scrape them. Their metrics are pushed to the Pushgateway, and Prometheus then pulls them from there.
Exporters — expose metrics from other systems in the Prometheus format. Targets are how Prometheus gets metrics from a source. Often the application itself exposes metrics, as Kubernetes does. For services that don’t, Prometheus uses exporters: programs that pull data out of an application and convert it into the Prometheus format.
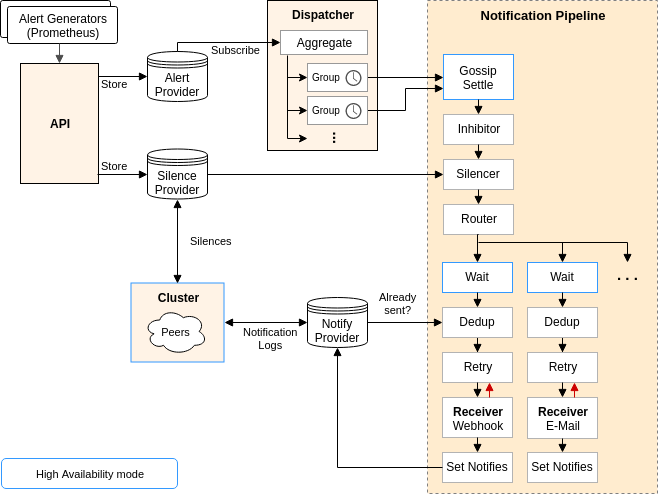
Alertmanager — receives and handles alerts. Alertmanager is part of the Prometheus architecture, but it runs as a separate server. When configured, Prometheus sends alerts straight to it.
🍻 Prometheus scrapes metrics from jobs and exporters directly, or through the Pushgateway for short-lived jobs. It stores everything locally and runs rules over that data to aggregate and record new time series, or to fire alerts when needed. Grafana or other API consumers can then be plugged in to visualise the data.
The Prometheus series
- Part 1. Prometheus and the Story of the Trident 🔱
- Part 2. Prometheus Architecture (you are here)
- Part 3. The Achilles’ Heel of Prometheus (coming soon…)